Survey grade at a glance
Find the marks before you go looking for them.
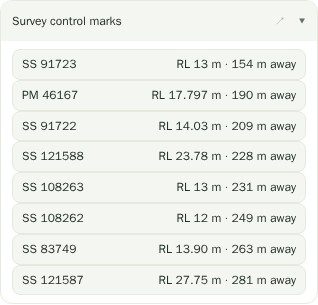
The Survey control marks section pulls the SCIMS marks in the vicinity of the selected lot and plots them on the imagery with their identifiers, so the mark search that normally happens in a separate portal happens on the same screen as everything else.
Because it is drawn over 10 cm LPI imagery rather than a schematic, you can usually see what you are driving to — whether the mark is in a nature strip, under a driveway, or in the middle of a paddock — before you commit an afternoon to it.
Bearings and distances on every boundary.
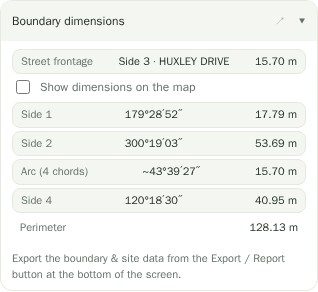
The Boundary dimensions section labels each boundary segment of the parcel with its length and bearing, derived from the cadastral geometry. It reads the way a plan reads, and it handles curved frontages as arcs rather than breaking them into a run of meaningless short chords.
That last part matters more than it sounds: a curved frontage that gets treated as four separate straight segments is how automated tools end up putting the front setback on the wrong boundary. Ours folds the chords back into the arc they came from.
Straight into CAD, on the right grid.
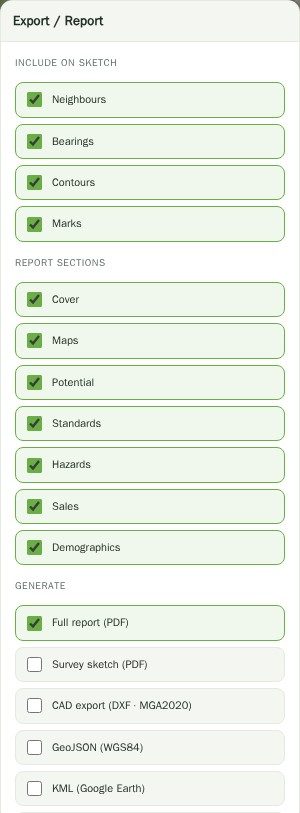
The export menu writes a DXF on MGA2020 — the projected grid your survey and civil files already work in, not a lat/long dump you have to reproject before it will sit on anything. Boundaries, and optionally contours, neighbouring parcels and control marks, come through as separate layers.
There is also LandXML for survey and civil packages, GeoJSON in WGS84 for GIS, KML for Google Earth and a Boundaries CSV. The survey sketch PDF is the quick one — a clean plan of the parcel with bearings and dimensions, with neighbours, contours and marks each switchable, for when someone just needs a page.
Questions
Are the bearings and distances from the deposited plan?
No. They are computed from the digital cadastral geometry, which is an adjusted spatial product rather than a transcription of the DP. They are usually close, and they are not authoritative. For anything that depends on a boundary being where you think it is, work from the plan and a field survey.
What datum and projection does the DXF use?
MGA2020 — Map Grid of Australia on GDA2020, in the appropriate zone. That is the grid NSW survey and civil work is done on, so the file drops onto an existing job without reprojection. GeoJSON exports are WGS84 as the format requires.
Which SCIMS marks are shown?
The control marks in the vicinity of the selected parcel, with their identifiers, drawn on the map. It is a reconnaissance aid — always confirm currency, class and order in SCIMS itself before you rely on a mark.
Does it handle curved boundaries properly?
Yes. Curved frontages are reconstructed as arcs rather than being left as a series of short chords, which is what keeps setbacks and frontage measurements landing on the correct boundary. It was a real bug once and it is specifically tested now.
Can I export contours with the boundary?
Yes — contours can be included in the DXF and LandXML exports and on the survey sketch PDF, along with neighbouring parcels and control marks. Each is a separate toggle.