NSW 10 cm imagery at a glance
10 cm, not "satellite".
Most property tools show you a generic global satellite mosaic. It is fine for context and useless for detail: at suburban scale it smears, and the capture might be four years old.
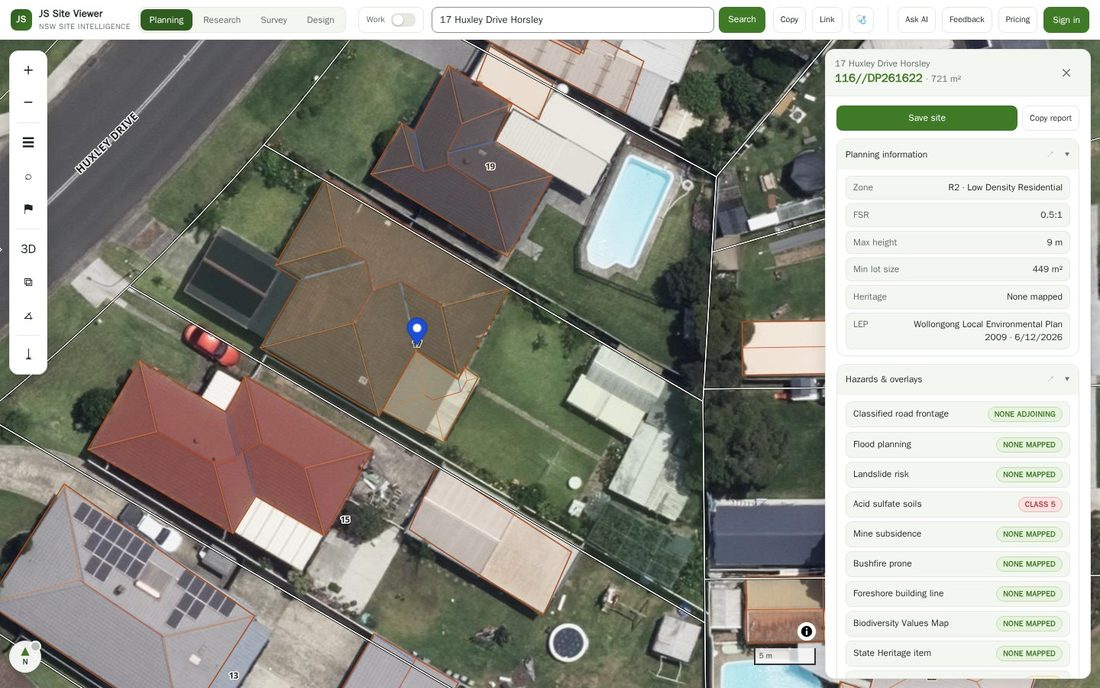
JS Site Viewer defaults to the NSW SIX LPI imagery — the state government’s own aerial capture at 10 cm ground resolution. At that resolution you can see the driveway crossing, the existing shed, where the fall in the backyard actually is, the neighbour’s window that is going to come up in the overshadowing argument, and the tree that is going to come up in everything.
Every other layer in the app — lot lines, house numbers, zoning, hazards, contours, setback envelopes — draws over it, so the analysis sits on top of a photograph rather than beside one.
See what used to be there.
Switch on time travel and step back through the historical imagery archive. It answers questions that are otherwise expensive to answer: when was the existing dwelling built, what was on the site before it, when did the neighbour put up the structure that is now on the boundary, and has that "vacant" lot ever had anything on it that might have contaminated it.
For anything with a demolition, a boundary dispute or a contamination question in it, this is usually the fastest first check.
And a basemap for when the photo is the problem.
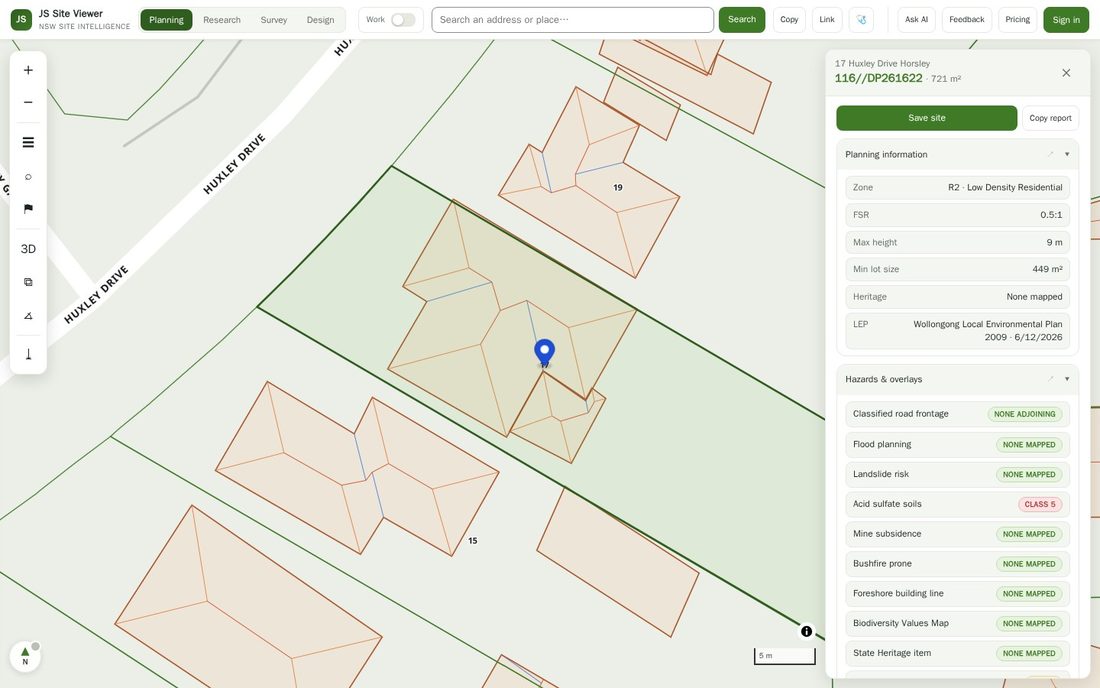
Aerial imagery is the wrong background for a drawing. JS Streets is our own vector basemap — white roads, grey paths, black labels, faded lot lines, everything else turned down — so lines and dimensions read clearly over it. Individual layers can be switched off: buildings, roads, street names, transit, paths, land-use tints, parks, points of interest, place labels.
There is also a plain Schematic (white) base for exports and printed plans, and Queensland state imagery for work that crosses the border.
Questions
How current is the imagery?
It depends on the area. NSW aerial capture runs on a program that revisits urban areas more often than rural ones, so metropolitan Sydney and the coastal centres are refreshed far more frequently than the far west. Use time travel if the capture date matters.
Is 10 cm actually different from the usual satellite layer?
Very. The generic global mosaics are typically somewhere between 30 cm and a metre per pixel depending on where you are. At 10 cm you can resolve individual pavers, gutters and fence posts.
Can I use the imagery in a report I send a client?
The branded PDF site report includes map figures, and the NSW imagery is CC-BY 4.0, which permits that with attribution. The report carries the attribution automatically. Check the licences page for the full list.
How far back does time travel go?
It steps through the captures held in the Esri historical imagery archive for that location. The number of available captures varies by area — dense urban areas have many, remote areas have few.
Will you add Nearmap or Metromap?
It is planned as a metered add-on rather than something bundled into the base subscription, because premium imagery is licensed per-view and pricing it into everyone’s plan would raise the price for people who never use it.