Feasibility at a glance
What's possible here, and why.
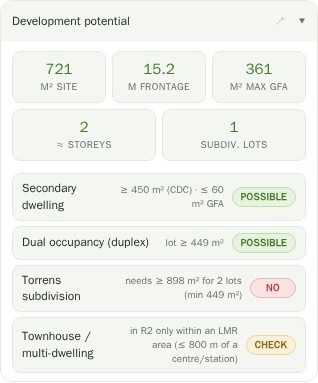
The development potential panel answers four questions for the selected lot: secondary dwelling, dual occupancy, Torrens subdivision, and townhouse or multi-dwelling housing. Each gets a plain verdict — Possible, Check or No — and, importantly, the reason next to it: "lot ≥ 600 m²", or "needs ≥ 1,200 m² for 2 lots", or "no minimum lot size layer here".
"Check" is used deliberately and often. Where the R2 answer depends on the site sitting inside a mapped Low and Mid-Rise Housing area, the panel says exactly that rather than guessing — and the uplift section runs the actual precinct test against the state's mapped areas and exclusion map.
Above the verdicts sit the headline metrics: site area, estimated frontage, maximum GFA, the approximate storey count from the height limit, and the number of lots the minimum lot size would allow.
Subdivision scenarios you can see, not just count.
Dividing lot area by minimum lot size is arithmetic anyone can do. The useful question is whether the resulting lots are actually shaped like lots — which depends on frontage. The scenarios panel models side-by-side Torrens splits from one lot up to five, using the real boundary and a minimum lot width you set, and marks each scenario "meets min" or "below min" against the mapped minimum lot size.
Click a scenario and it's drawn over the parcel: each proposed lot shaded and labelled A, B, C with its own area, plus the indicative GFA that scenario carries. Where the parcel can't be split at all, the note tells you which constraint stopped it — the minimum lot size or the frontage.
It models an equal side-by-side split. Battle-axe and handle layouts, corner splays, drainage and access aren't modelled, and the panel says so on the page.
A buildable envelope from the actual setback rules.
Switch to design mode and the viewer insets the lot boundary by the setbacks that apply to the development type you've picked, and draws what's left. Ground and upper-storey envelopes are separate, because the step-back matters. The envelope is labelled with its area and the front, side and rear setbacks used.
The setbacks aren't a rule of thumb. They're resolved from the state complying-development codes — the Housing Code and the Low Rise Housing Diversity Code — and, in the councils whose DCP has been extracted, from the council control where it applies instead. Rules that vary by lot size, lot width or building height are matched to this lot's actual figures.
The frontage model follows the Low Rise Housing Diversity Design Guide on corner lots: which boundary is the primary road, which is secondary, and the special case where a detached dual occupancy takes a front setback on both frontages and has no rear setback at all. Where the guide leaves the choice to the applicant, you get a control; where it's prescribed, it's computed and reported.
Which control is actually binding — FSR or height.
With an envelope drawn, the massing figures tell you where the ceiling really is: the footprint after any site-coverage control, the storeys the height limit allows, the floor area that produces, and whether the site is limited by floor space ratio or by the envelope itself. On a lot where FSR bites first, buying more height achieves nothing — and it's better to know that in the first ten minutes.
Trace a proposed footprint on the plan and it's checked live: area, site coverage percentage, GFA against the allowance for the chosen pathway, resulting FSR, and whether any corner falls outside the buildable envelope. The lot and envelope export as an IFC mass model for Revit or ArchiCAD, or as glTF.
Complying development, tested clause by clause.
Pick a pathway and a housing type and the viewer builds the standards card for it. For CDC that's dual occupancy, dwelling house, secondary dwelling and semi-detached dwelling; for the merit DA path, dual occupancy, manor house, attached dwellings and terraces, and residential flat buildings.
A dual-occupancy card opens with a one-line verdict — likely eligible, or undersized — then the tests behind it: minimum lot size and minimum frontage against this lot's real figures, maximum height, maximum storeys, maximum GFA, minimum landscaped area, and side, rear and front setbacks. Each figure carries the clause it came from, and for the low-rise diversity types there's a walkthrough of the Design Guide criteria, separating quantitative standards from the merit criteria a certifier judges.
The pathway selector is labelled a prototype in the app, and we'll label it one here too. It's genuinely useful for screening; it is not a certifier's assessment.
Yield, amenity targets and a margin on your numbers.
Where an FSR is mapped, the yield study converts permitted GFA into net saleable area and an indicative dwelling count with a rough one, two and three-bedroom mix, alongside the amenity targets that apply to apartment development — deep soil at 7% of the site, communal open space at 25%, and roughly a space per dwelling. Those are targets to size against, not an Apartment Design Guide compliance assessment, and the panel says so.
The feasibility panel then runs the money, entirely on assumptions you control: land price, build rate per m² of GFA, sale rate per m² of net saleable area, efficiency and soft costs. It reports gross realisation, total development cost including acquisition costs and an approximate margin-scheme GST, and the resulting profit, development margin and return on the land price. Change any input and it recomputes as you type. It's seeded with generic NSW medium-density rates, which is exactly why you should replace them. The feasibility panel is a Pro section.
What each figure is, and what it needs
| Figure | How it's derived | Needs |
|---|---|---|
| Maximum GFA | Lot area × mapped floor space ratio | An FSR mapped over the lot |
| Storeys | Height of building ÷ 3.1 m floor-to-floor | A height limit in metres, not a reduced level |
| Dwelling yield | GFA × efficiency ÷ average dwelling size | An FSR; the assumptions are shown with the result |
| Subdivision lots | Modelled side-by-side split against minimum lot size and your minimum width | A minimum lot size and a workable frontage |
| Buildable envelope | Boundary inset by the setbacks resolved for the chosen development type | Design mode, and a development type selected |
| Development margin | Gross realisation less land, acquisition, build, soft costs and GST | Your own rates — the defaults are generic |
Questions
What happens on a lot with no mapped FSR?
Anything that depends on FSR says so instead of guessing — the yield study tells you it needs an FSR to compute permitted GFA, and the feasibility panel gives you a GFA field to enter yourself. Plenty of low-density lots have no mapped FSR, and height plus setbacks are the real constraint there.
Does it check the Apartment Design Guide?
Not as a compliance assessment, and we won't claim it does. It reports the ADG amenity targets sized against your site — deep soil, communal open space, parking — and lists the relevant ADG sections for solar access, natural ventilation, apartment size and ceiling heights so you know which clauses you're up against. Solar access and cross ventilation depend on a design, and there isn't one yet at this stage.
Which development types are modelled?
The pathway selector has four complying-development leaves — dual occupancy, dwelling house, secondary dwelling and semi-detached dwelling — and four merit DA leaves: dual occupancy, manor house, attached dwellings and terraces, and residential flat buildings. Separately, the development standards section screens this lot against the code minimums for dwelling house, secondary dwelling, dual occupancy attached and detached, terraces, manor houses, multi-dwelling housing, townhouses, residential flat buildings and shop-top housing.
Are the subdivision layouts a real design?
No. They're an equal side-by-side Torrens split modelled off the real boundary, so they respect frontage and minimum lot size but not battle-axe handles, corner splays, drainage or access. Use them to see whether a split is plausible and roughly how the lots would sit, then take it to a surveyor.
Can I take the envelope into CAD or BIM?
Yes. The lot and buildable envelope export as an IFC4 mass model for Revit or ArchiCAD and as glTF, and the parcel itself exports as DXF in MGA2020, LandXML, GeoJSON and KML. The site report exports as a PDF, with the development potential and standards sections included.
Where do the default cost rates come from?
They're generic NSW medium-density assumptions, and the panel says so directly above the result. They exist so the model produces something the moment you open it, not because they're right for your site. Replace all four inputs with your own numbers before you read anything into the margin.