Levels & contours at a glance
The question every site starts with.
Is it flat? Because if it isn’t, the retaining walls, the stepped slab, the driveway grade and the stormwater all get more expensive, and a site that pencilled at a glance stops pencilling.
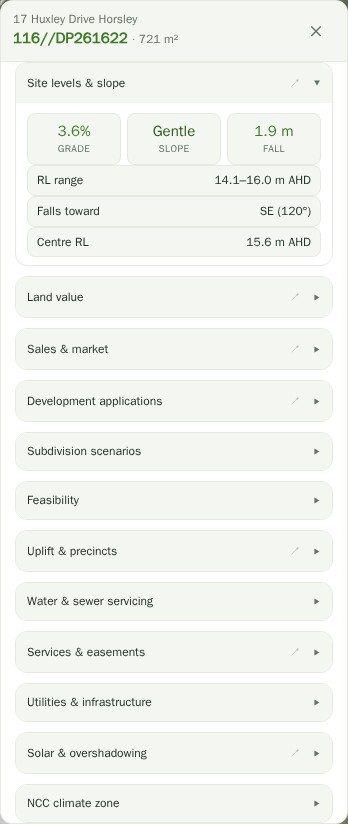
Select a lot and the Site levels & slope section gives you the quick answer: the high point, the low point, the total fall, the slope as a percentage, and which way the land runs. It is sampled at the lot corners from the national 1-second (~30 m) SRTM elevation model, so it is a grade indication rather than a survey — and the panel says so.
For the detailed picture, the survey tools draw contours from the NSW LiDAR elevation data over the parcel at a 2 m interval, which is a different and much sharper dataset. You can also drop a spot level anywhere — click a point and get its reduced level in metres AHD.
Cut and fill, before the civil engineer.
The Cut & fill section takes that same sampled surface and works out what it would cost in earthworks to get a level building platform out of it — how much material comes off the high side, how much goes onto the low side, and whether the two balance.
It is an indicative number built on a coarse elevation model, not a civil design. But the difference between "balances on site" and "forty truckloads out" is usually visible immediately, and that is the difference the feasibility cares about.
Two elevation datasets, and it matters which you are reading.
This is worth being precise about, because most tools are not. The quick fall and grade summary on the site report is sampled from the national 1-second SRTM model — roughly 30 m horizontal resolution, around 5 m vertical accuracy. It is fine for "is this flat or steep" and useless for anything finer.
The contours and spot levels in the survey tools are a different source: NSW LiDAR-derived elevation from DCS Spatial Services, interpolated between contour vertices, at roughly 1–2 m vertical accuracy. That is sharp enough to see a batter, a bench or a creek line inside a single suburban lot rather than averaging the whole block into one number.
Both carry through to the exports: contours can be included on the survey sketch PDF and in the DXF and LandXML files, so what you see here is what lands in CAD.
Questions
How accurate are the levels?
It depends which number you are reading. The fall and grade summary on the site report comes from the ~30 m national SRTM model, so around 5 m vertically. The contours and spot levels come from NSW LiDAR data and are around 1–2 m. Neither is good enough to set a floor level; both are good enough to tell a 1 m fall from an 8 m fall.
Why not use the LiDAR data for everything?
Because the whole-of-lot summary has to resolve on every parcel in the state the moment you click it, and the corner-sampled national model always answers. The LiDAR contours are fetched when you ask for them in the survey tools. We label which is which rather than quietly averaging them together.
Can I change the contour interval?
Yes. The default is 2 m — the finest the app draws — and on steep or rural sites, where a coarser interval reads better, you can step it out to 4, 6, 10 or 20 m.
Does it work everywhere in NSW?
The grade summary does. LiDAR contour coverage is extensive but not perfectly uniform — capture dates and densities vary by region, and where contours are unavailable the app falls back to the coarser model rather than showing nothing.
Is this a substitute for a contour survey?
No, and it should not be used as one. It answers "is this site flat enough to be worth pursuing", not "where does the floor go". A registered surveyor’s detail survey is the document your engineer and certifier will need.
Do levels and cut & fill need Pro?
Yes. Both sections call a government elevation service per site, so they are included in Pro rather than the free tier. Hazards, zoning, cadastre and the basic site report stay free.