Site finder at a glance
Start with the area, not the address.
Most property tools make you know the site before you can look at it. The site finder works the other way around: you describe the lot you want, and it tells you which ones in the suburb match.
- Choose an areaType a suburb name or a four-digit postcode and the matching NSW boundary is outlined on the map, so you can see exactly what's being scanned. Or press "View" to scan only what's on screen.
- Set the filtersMinimum and maximum lot size, minimum frontage, the zones you care about, the development types you're chasing, and the constraints you won't touch.
- Scan, then refineThe scan fetches the area once and keeps it. After that, changing a filter re-runs the match instantly — no waiting on government services again. You can cancel a scan mid-way at any time.
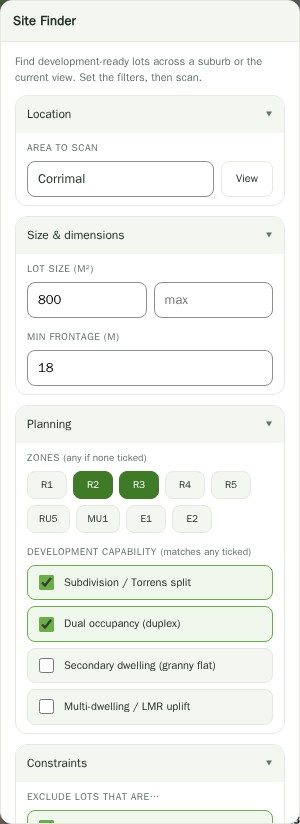
Filter by what a lot can become, not just how big it is.
Area alone doesn't tell you much. Four "development capability" filters test each lot against its own zone and its own mapped minimum lot size, using the same rules as the site report:
Subdivision / Torrens split — a residential lot at least twice its mapped minimum lot size. Matches
are tagged with the number of lots the arithmetic allows.
Dual occupancy (duplex) — R1, R2, R3 or RU5, above the minimum that applies.
Secondary dwelling (granny flat) — a residential lot over the complying-development threshold.
Multi-dwelling / LMR uplift — R1, R3 and R4 outright. R2 lots are tagged "Multi · LMR?"
rather than claimed, because in R2 it depends on the lot sitting inside a mapped Low and Mid-Rise
Housing area.
Tick several and a lot qualifies if it matches any of them.
Rule out the constraints before you build the shortlist.
Three exclusions run against real government polygons, not a guess: flood planning area, bushfire prone land, and heritage listing. Tick one and every affected lot drops out of the results entirely.
Leave them unticked and the constraints still show — matched lots carry a warning tag so you can see at a glance which ones come with homework attached.
Every match on the map, and on your hard drive.
All matching lots are shaded green on the map at once and the camera frames them, so the pattern of where the opportunity sits in a suburb is visible immediately. Click any shaded lot, or any row in the results list, and it opens as a full site report — zoning, controls, hazards and feasibility already loaded.
Sort by largest, smallest, subdivision yield or widest frontage. The panel lists the top forty, and the CSV button exports every single match: lot and DP, zone, area, frontage, minimum lot size, subdivision yield, each capability flag, each constraint flag, and the coordinates.
Suburb scan or view scan — which to use
| Suburb / postcode scan | Current view scan | |
|---|---|---|
| Best for | Working a whole market — "every splittable R2 lot in Corrimal" | A block, a street or a precinct you've already zoomed to |
| Area scanned | The official NSW suburb or postcode boundary, drawn on the map | Exactly what's on screen |
| Boundary shown | Yes — the search area is outlined so there's no ambiguity | No, the screen is the boundary |
| Out-of-area lots | Clipped to the real suburb polygon, not a rectangle | Not applicable |
| Speed | Slower on a large suburb; cancel any time, and re-filtering is instant afterwards | Fast — you control how much is in frame |
Questions
How large an area can I scan?
A whole suburb or postcode works. The scan walks the area tile by tile, so a large suburb takes longer than a small one, and the status line shows how many cells are done. You can cancel at any point, and once an area is fetched it's kept — changing filters after that re-runs the match instantly without touching a government service again.
Which zones can I filter by?
R1, R2, R3, R4, R5, RU5, MU1, E1 and E2. Leave them all unticked to include every zone. The zone shown for each lot is sampled from the NSW land zoning layer at the lot's centroid.
What does the "Multi · LMR?" tag mean?
It means the lot is R2, where multi-dwelling potential depends on the site falling inside a mapped Low and Mid-Rise Housing area rather than on the zone alone. Rather than claim it either way, the finder flags it as a question. Open the lot and the site report runs the actual precinct check for you.
Does excluding flood or bushfire make a lot safe?
No. The test is a point-in-polygon check at the lot's centroid against the published state layers, so a lot partly affected at its edges can still pass. Use it to cut an obvious set of lots out of a long list, then check the individual sites properly before you rely on it.
What's actually in the CSV?
One row per matching lot: lot and DP identifier, zone, area in m², estimated frontage, mapped minimum lot size, subdivision yield, dual-occupancy, secondary-dwelling and multi-dwelling flags, flood, bushfire and heritage flags, and the latitude and longitude. It exports every match, not just the forty shown in the panel.
Can I open a result as a full site report?
Yes. Click a shaded lot on the map or a row in the results list and the viewer flies to it and opens the site report, with planning controls, hazards, boundary dimensions, levels and feasibility for that parcel.