Planning controls at a glance
Start from the parcel, not a pin on a map.
Every lookup begins with the real cadastral parcel. Click anywhere and the viewer resolves the lot underneath, draws its boundary, and reports its lot and DP identifier and its land area. Search works the same way from the other direction: type an address, or type a lot and plan — "2//DP544216", "Lot 2 DP544216" or just "DP544216" for the whole plan — and it resolves to the parcel.
Address points in the government data often sit on the road verge rather than inside the parcel, so a click or a geocode that lands just outside a boundary is snapped to the nearest lot within about forty metres. Click a genuine road or reserve and it correctly tells you there's nothing there.
Lot lines are served from our own pre-built vector tiles where they've been prepared, which is why they draw instantly and stay crisp when you rotate the map. Everywhere else the viewer queries the live NSW cadastre, so coverage isn't limited to the areas we've cached.
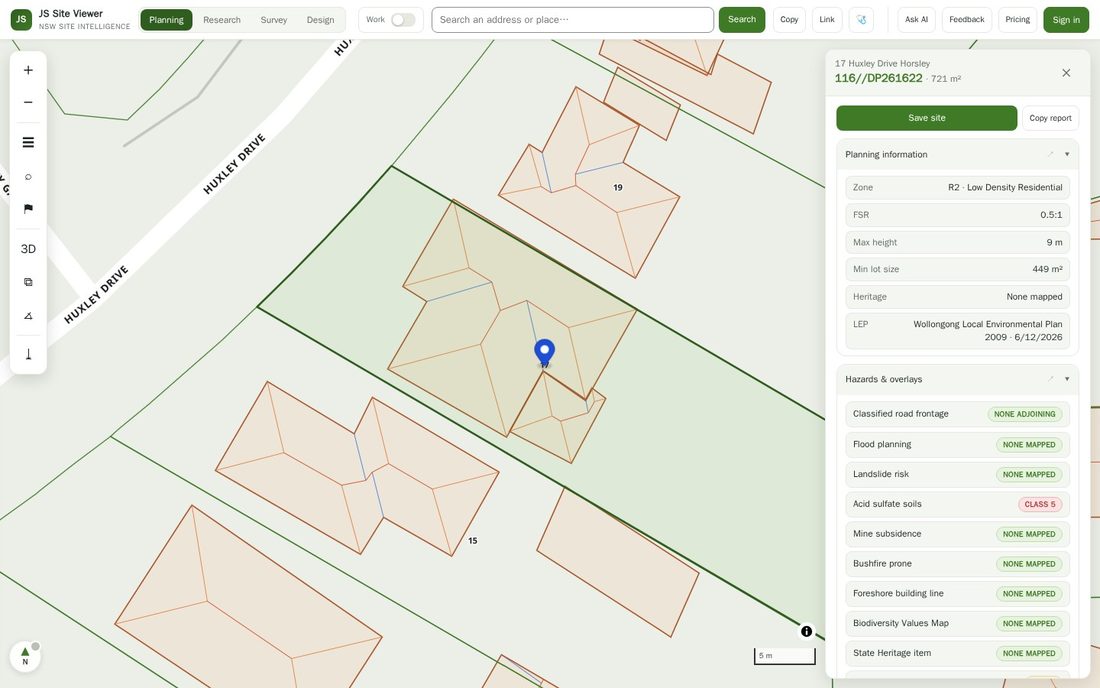
Zone, minimum lot size, height, FSR — in one panel.
The site report opens with the controls that actually determine what's possible: the land zoning code and its full class name, the minimum lot size, the maximum height of building, and the floor space ratio. Any heritage item mapped over the parcel is listed alongside them, and flagged rather than buried.
Each value is read from the NSW Department of Planning, Housing & Infrastructure primary planning layers at the lot itself, and the panel names the instrument the values came from — the LEP, with the currency date the state records for that mapping. If a control simply isn't mapped for the site, the panel says so with a dash instead of inventing a number.
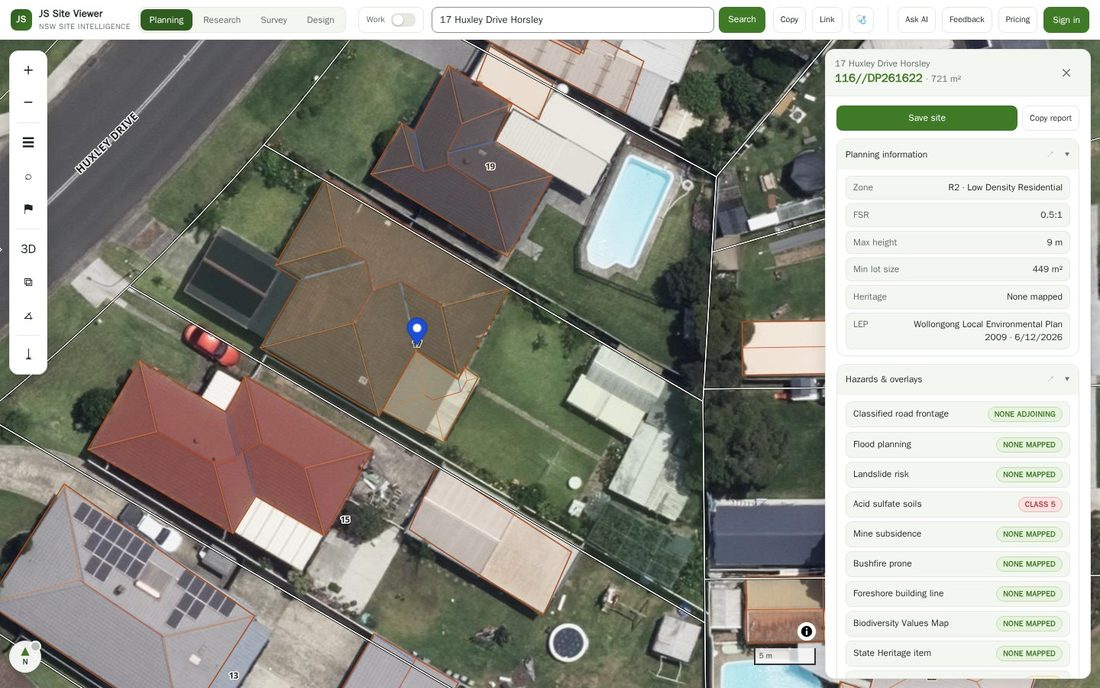
See the control across the whole street, not just your lot.
Each of the four controls is also a map layer, rendered from our own vector tiles with a graded colour ramp and the value written across each polygon — so a minimum lot size stepping from 449 m² to 550 m² halfway down a street is visible instead of hidden.
Zoom in with a single control layer on and the labelling changes: instead of lot numbers, every parcel is labelled with its own value for that control. One glance tells you which side of the street is 9.5 m and which is 8.5 m. Click any polygon for the value on its own.
Boundary dimensions, bearings, and what's registered over the land.
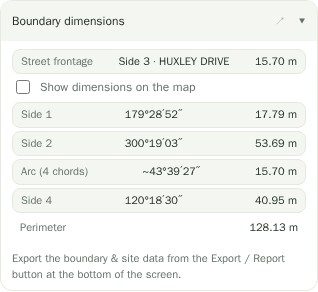
The selected lot's sides are labelled along the boundary with a geodetic bearing in degrees, minutes and seconds and a ground distance, with collinear cadastral segments merged so each side reads as one side. Tap a boundary and the map rotates so it sits at the bottom of the screen, which is how you actually think about a frontage. The table exports as a CSV.
Public easements from the NSW land parcel and property theme can be switched on over the top, along with suburb, LGA and other administrative boundaries.
Permitted uses, and an honest note about coverage.
Two things sit under the controls. The first is statewide: the development standards from the state complying development codes — the Housing Code and the Low Rise Housing Diversity Code — tested against this lot's area and frontage, grouped by dwelling type, with the clause each figure came from. The badge on each type reports only the minimum lot size and width test, and says "Check" rather than "yes" when no minimum is mapped.
The second is not statewide, and we'd rather say so here than have you discover it in the app. The full LEP land-use table — permitted without consent, permitted with consent, prohibited — has been extracted for Wollongong, Shellharbour and Shoalhaven only, along with those councils' DCP controls. On a lot in any other LGA the section tells you the table isn't loaded rather than showing you another council's rules. More councils are being added.
What each control actually governs
| Control | Unit | What it decides |
|---|---|---|
| Land zoning | Code + class | Which uses are permissible at all, and which development pathways are even open to you |
| Minimum lot size | m² (ha in rural zones) | Whether the lot can be subdivided, and how many lots it could yield |
| Height of building | Metres, or a reduced level | How many storeys fit — the viewer reports the storey count that height implies |
| Floor space ratio | Ratio, e.g. 0.5:1 | Total floor area allowed: lot area × FSR is the gross floor area ceiling |
| Heritage | Item name | Whether a listing sits over the parcel, which changes the assessment path entirely |
Questions
Does it cover every council in NSW?
For the cadastre and the four core controls, yes — they come from statewide layers, so any lot in New South Wales resolves. The council-specific land-use tables and DCP controls are a separate, smaller dataset, currently Wollongong, Shellharbour and Shoalhaven.
Can I search by lot and DP instead of an address?
Yes. "2//DP544216", "2/DP544216" and "Lot 2 DP544216" all work, and a bare "DP544216" returns the lots in that plan. Address search runs off the NSW address points, and you can also just click the map.
Is the land area the surveyed area?
No. It's calculated from the cadastral polygon, which is close but not identical to the area written on the deposited plan. Use it for sizing and screening; use the DP for anything that has to be exact.
Are the boundary bearings the same as the DP bearings?
No, and the app says so on the panel. They're geodetic bearings and ground distances computed from the cadastral geometry. They're reliable for orientation, frontage and setback thinking; confirm against the deposited plan for survey use.
Why does a control sometimes show a dash?
Because the LEP doesn't map that control for that land. Plenty of lots have a zone and a minimum lot size but no mapped FSR, for example. The panel leaves it blank rather than substituting a default, and the feasibility sections tell you which calculations that makes impossible.
Can I see the controls for every lot at once?
Yes. Turn on one of the four control layers and zoom in, and each parcel is labelled with its own value for that control instead of its lot number. It's the fastest way to spot where a control steps mid-block.