Cadastre, zoning, feasibility, hazards, levels and survey data for any lot in New South Wales — built entirely on official NSW government sources. Made for the people who make property decisions.
How it works
No logging into six government portals. No stitching layers together by hand.
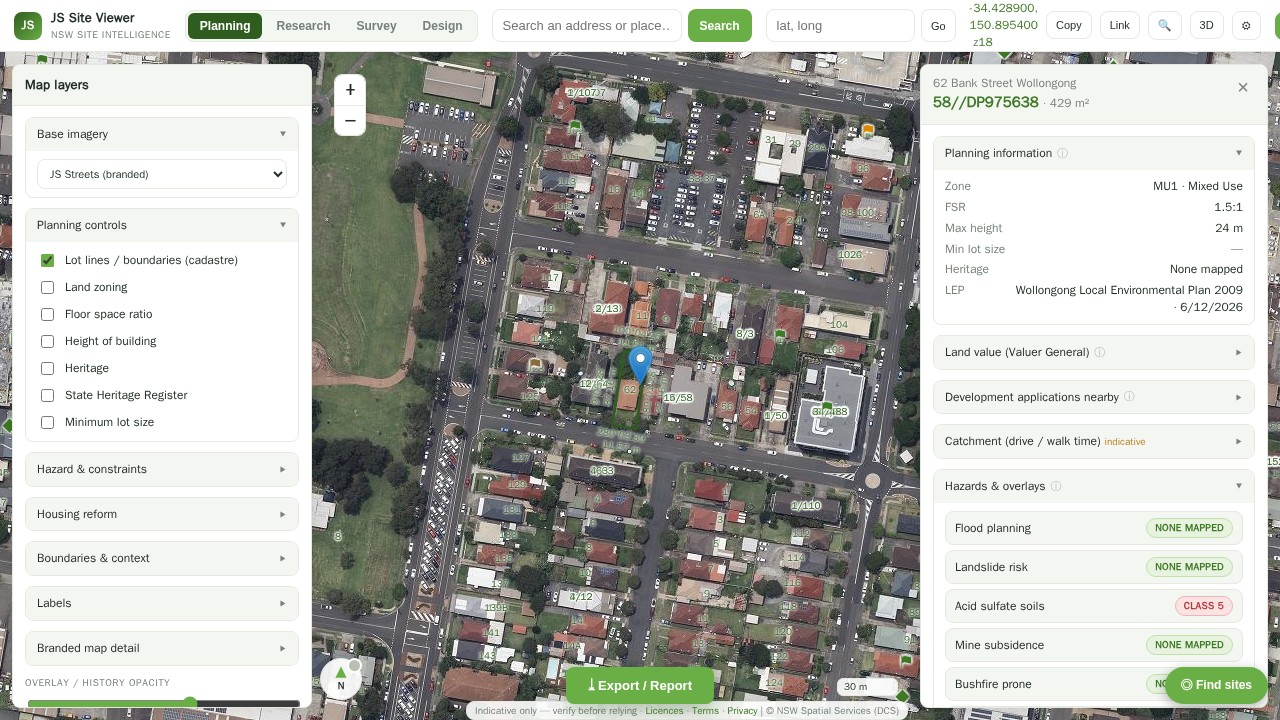
Type an address or lot/DP. We drop you straight onto the parcel with 10 cm NSW aerial imagery.
The full report builds itself — zoning, controls, hazards, levels, sales and feasibility, all at once.
Branded PDF reports, plus DXF / GeoJSON / KML for CAD and GIS. Ready for clients and lodgement.
Who it's for
The same authoritative NSW dataset, surfaced for how you actually work.
What's inside
Click any lot and get an instant, exportable site report.
Every lot boundary, DP, LEP zone and minimum lot size across NSW — plus full LEP land-use tables for the Illawarra. Learn more →
Development potential, GFA, ADG amenity checks and side-by-side subdivision layouts. Learn more →
Filter every lot in a suburb by size, frontage, zone and what can be built on it. Learn more →
Flood, bushfire, acid sulfate soils, heritage and other planning constraints. Learn more →
Contours and spot levels from NSW LiDAR, plus fall across the site and cut & fill. Learn more →
SCIMS marks, boundary dimensions and bearings — export to DXF, GeoJSON or LandXML. Learn more →
Official LPI aerial imagery — sharper than the generic satellite layers. Learn more →
Drive/walk catchments, live transit & aircraft, schools, demographics. Learn more →
Branded PDF site reports plus DXF / GeoJSON / KML — ready for clients & CAD. Learn more →
Compare several lots side by side, or amalgamate them into one development site. Learn more →
Low- and Mid-Rise Housing, TOD precincts and the other NSW housing-reform overlays. Learn more →
Watch an address or suburb and get emailed when a development application is lodged nearby. Learn more →
Why JS Site Viewer
National platforms spread thin and charge accordingly. We go deep on New South Wales and pass the savings on.
Not a national tool with NSW bolted on — every layer is the authoritative NSW source, including 10 cm LPI imagery.
Full feasibility & exports for less than a quarter of what the big platforms charge for the same depth.
Cadastre, planning, hazards, VG sales & ABS — properly licensed government open data.
Pricing
One site report that saves you an afternoon of portal-hopping covers the month.
Full plan details on the pricing page. Prices in AUD. Premium imagery & national coverage coming soon.
FAQ
Official NSW & Commonwealth open data — Spatial Services (cadastre, imagery, SCIMS, elevation), Planning & Environment (zoning, hazards), the Valuer General (sales, land value), and the ABS. Every source and licence is listed on our licences page.
No. JS Site Viewer is an indicative research tool — figures are computer estimates and can be incomplete or out of date. Always verify with the relevant council, a registered surveyor and/or a certifier before acting.
Yes — every parcel in New South Wales. National coverage is on the roadmap; for now we go deep on NSW rather than shallow everywhere.
Pro includes branded PDF site reports plus DXF, GeoJSON and KML exports for CAD and GIS workflows.
Free forever with no card. Pro and Team are monthly or annual subscriptions (2 months free annually), billed securely via Stripe. Cancel anytime.
Search any NSW address, click the lot, and the whole report builds itself.
Start free → Book a demo